Analysis of Gross Profit Contribution for Major Customer to CUBI Benchmarks
Identify the Problem:
Problem: Brian, after investing $500,000 in new information systems, felt overwhelmed by the extensive data output. Despite the system being designed by a trusted accounting firm, the information was so extensive that Brian felt he had lost his grip on the business. This, combined with a noticeable slowing down of cash flow, indicated potential issues in the business’s performance.
Determine Key Metrics:
Key Metrics:
Gross Profit Contribution per Production Hour
Production Hours Billed vs. Production Hours Available for Billing
Planned Average Gross Profit per Production Hour
Actual Gross Profit per Hour in Sales to Major Customers
Charged Unit Benchmark Index (CUBI)
Determine Key Metrics:
Request budgeted sales, materials at cost, and production hours for the year.
Use the provided data from:
# Load required librarieslibrary(knitr)library(kableExtra)# Create data framedata <-data.frame(Label =c("A", "B", "C", "D", "E"),Description =c("Sales", "Materials at Cost Price", "Gross Profit Contribution", "Production Hours", "Target Average Contribution Per Hour"),Value =c("$60,000,000", "$40,000,000", "$20,000,000", "250,000 hours", "$80"))# Ensure that all column names are properly assignedcolnames(data) <-c("Label", "Description", "Value")# Create a customized table using kable and kableExtra with the specified captionkable(data, format ="html", caption ="Table 2-1: Target Average Contribution per Hour") %>%kable_styling(bootstrap_options =c("striped", "hover", "condensed", "responsive"),full_width =FALSE, position ="left") %>%column_spec(1, bold =TRUE, color ="black") %>%row_spec(0, bold =TRUE, background ="#f2f2f2") # Bold and highlight the header row
Table 2-1: Target Average Contribution per Hour
Label
Description
Value
A
Sales
$60,000,000
B
Materials at Cost Price
$40,000,000
C
Gross Profit Contribution
$20,000,000
D
Production Hours
250,000 hours
E
Target Average Contribution Per Hour
$80
Note:
Label C
( C = A - B )
Label E
( E = D / E)
Challenge Traditional Approaches:
Traditional Method: The company traditionally calculates gross profit by adding factory wages and expenses to the materials before deducting from sales. This method is based on the idea that factory wages and expenses vary with production, but as pointed out in the scenario, these costs have become more fixed in nature.
Establish Benchmarks:
Use the calculated CUBI of $80 as a benchmark.
Analyze Major Customers:
Identify the business’s biggest customers.
Analyze a few typical invoices for these major customers. Use the data from:
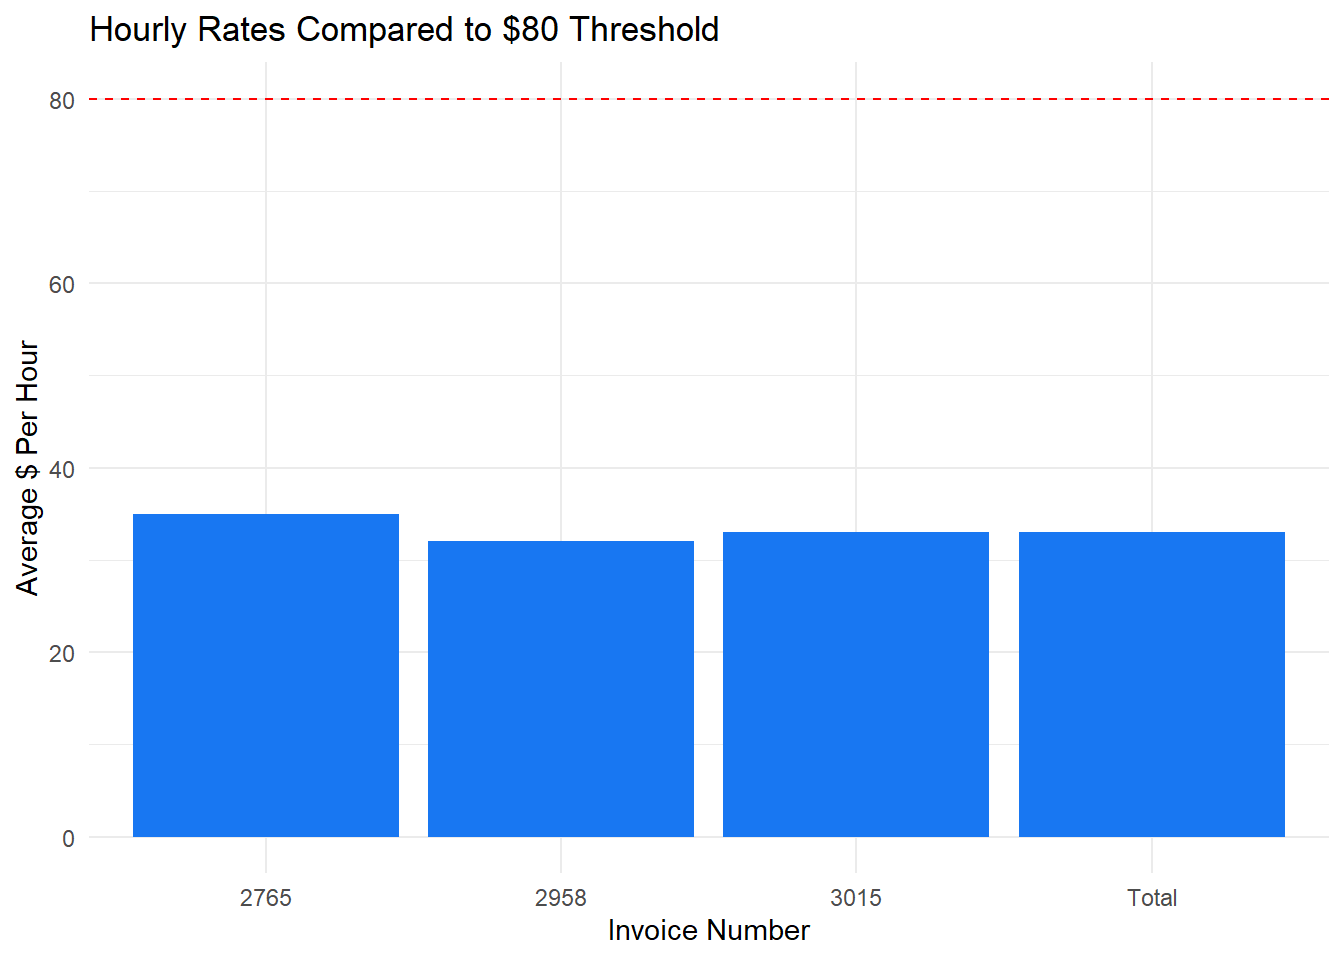
# Load required librarieslibrary(knitr)library(kableExtra)# Create data framedata <-data.frame(`Invoice Number`=c("2765", "2958", "3015", "Total"),`Invoice Price Net of Tax ($)`=c("$100,000", "$300,000", "$150,000", "$550,000"),`Materials Used ($)`=c("$68,000", "$200,000", "$102,000", "$370,000"),`Gross Profit Contribution ($)`=c("$32,000", "$100,000", "$48,000", "$180,000"),`Gross Profit (%)`=c(32, 33, 32, 33),`# of Hours`=c(914, 3125, 1450, 5489),`Average $ Per Hour`=c(35, 32, 33, 33))# Create a customized table using kable and kableExtra with the specified captionkable(data, format ="html", caption ="Table 2-2: Invoice Analysis of Number One Customer") %>%kable_styling(bootstrap_options =c("striped", "hover", "condensed", "responsive"),full_width =TRUE, position ="center", font_size =10) %>%column_spec(1, bold =TRUE) %>%row_spec(4, bold =TRUE, background ="#f2f2f2") # Bold and highlight the "Total" row
Table 2-2: Invoice Analysis of Number One Customer
Invoice.Number
Invoice.Price.Net.of.Tax....
Materials.Used....
Gross.Profit.Contribution....
Gross.Profit....
X..of.Hours
Average...Per.Hour
2765
$100,000
$68,000
$32,000
32
914
35
2958
$300,000
$200,000
$100,000
33
3125
32
3015
$150,000
$102,000
$48,000
32
1450
33
Total
$550,000
$370,000
$180,000
33
5489
33
Note:
Invoice Price Net of Tax ($)
( A )
Materials Used ($)
( B )
Gross Profit Contribution ($)
( C = A - B )
Gross Profit (%)
( D = C / A )
Number of Hours
( E )
Average $ Per Hour
( F = C / E )
Compare Actual Performance to Benchmarks:
Compare the actual gross profit contribution per production hour from major customers to the CUBI.
The analysis revealed that the company is getting an average gross profit contribution of $33 per hour from its largest customer who is taking 55% of output when the required average, based on the CUBI, is $80.
This significant discrepancy indicates that the business’s performance, at least with respect to this major customer, is falling short of the target benchmarks.